Balloon Tracking
While this is not 'Radio Astronomy' this project by John uses and demonstrates some of the hardware and software that we use for some radio astronomy observations. It is a good introductory project for someone who would like to do some Radio Astronomy and it's a kind of 'fun' and relatively cheap project.
Tracking Balloons – part 1
No- not the sort of balloons you see at a birthday party or at Christmas time, but the medium sized ones that are used to carry small scientific packages into the upper atmosphere. These balloons are filled with either Hydrogen or Helium gas.
As Hydrogen gas is much cheaper and not in limited supply as is Helium, Hydrogen is therefore the gas of choice used for the daily weather balloon launches by the Bureau of Meteorology (BOM).
Hydrogen is a flammable gas (remember the Hindenburg https://en.wikipedia.org/wiki/LZ_129_Hindenburg ) and so strict safety precautions must be followed when filling and releasing balloons with hydrogen gas. Remote filling and launching systems have been installed at airports to make the launching of weather balloons as safe as possible.
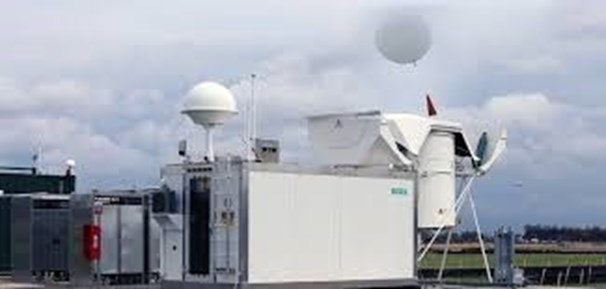
A hydrogen filled balloon being released from a Vaisala automated launcher https://www.vaisala.com/en.
The material used for these balloons is either a synthetic rubber called Neoprene or Latex. It is about 0.05mm thick when launched and about 0.0025mm thick when the balloon bursts at high altitude.
There are many groups which use balloons for scientific purposes. One amateur group in Adelaide is Project Horus which can be accessed with the following: -
www.projecthorus.org and www.areg.org.au/archives/category/activities/project-horus
More information is at https://github.com/projecthorus/radiosonde-auto-rx
The main professional group in Adelaide is the Bureau of Metrology (BOM) who release a weather balloon at 2315 GMT and 1115 GMT each day from most Australian and in our case in South Australia, the Adelaide Airport.
The instrumentation carried aloft measures temperature, pressure, humidity, wind speed and direction to an altitude between 16 km and 25 km. Wind speed, direction and altitude involve an onboard GPS unit for tracking. The balloon’s payload sometimes includes a small metalized reflector for ground-based radar tracking.
The data from the onboard instruments is transmitted on a frequency between 400 MHz and 403 MHz each second and amateur radio types (hams) have found that these radiosonde data transmissions from the weather balloons can be received using fairly cheap radio receivers and the data can also be decoded without too much difficulty.
See these websites for more information: -
https://www.rtl-sdr.com/receiving-weather-balloon-data-with-rtl-sdr/ a really good write up if you only do ‘Windows’
https://www.areg.org.au/activities-old/project-horus/high-altitude-balloon-tracking
https://www.areg.org/archives/209471
which describe software to display the position of a BOM weather balloon or a Project Horus balloon.
“radiosonde-auto-rx” runs on any LINUX computer including a Raspberry Pi.
However, another way to “track” a balloon is to use a computer running XP or WIN 7 or WIN10 with a free program SDR#, a Funcube dongle http://www.funcubedongle.com/ and a suitable and a simple ¼ wave antenna or as I used, a discone broadband antenna.
Receivers
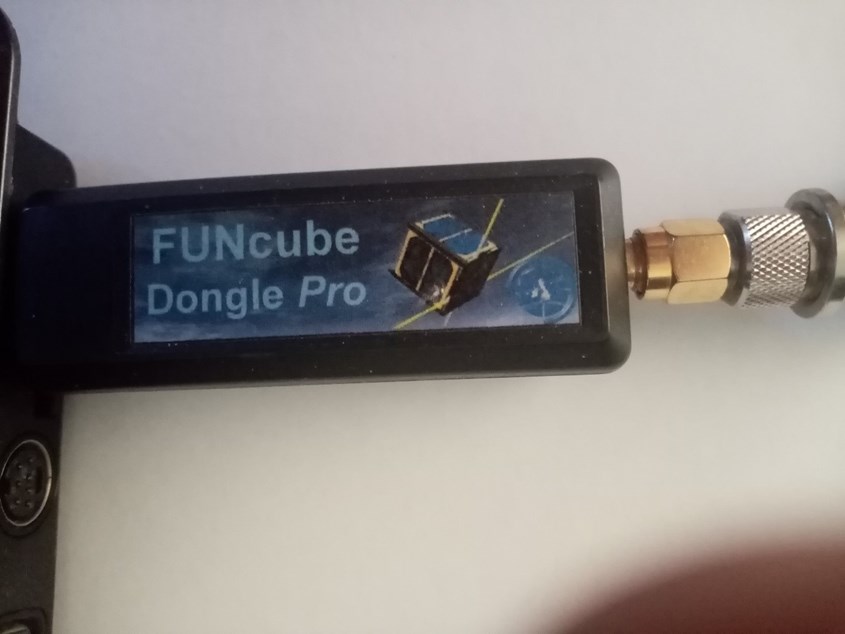
A ‘Funcube’ dongle.
A cheaper alternative to the Funcube dongle is a Software Defined Radio (SDR) dongle available on EBAY for less than $50. Google ‘sdr dongle ebay’
Another alternative is a communications receiver capable of tuning the required frequency and a bandwidth of about 6KHz on AM.
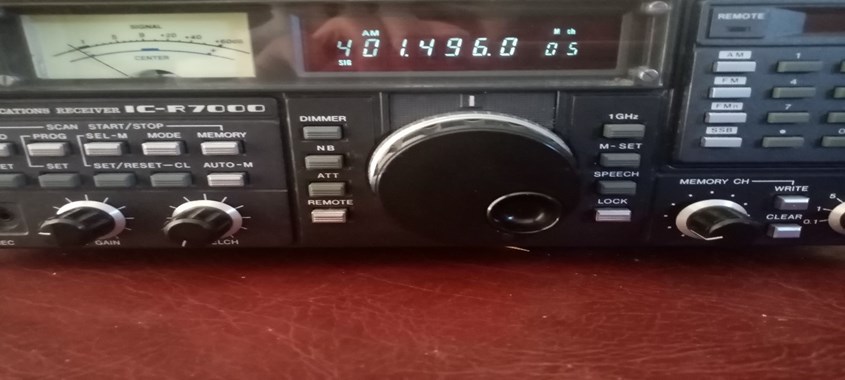
Here is an Icom R7000 communications receiver that is also suitable for Balloon tracking work.
Antenna
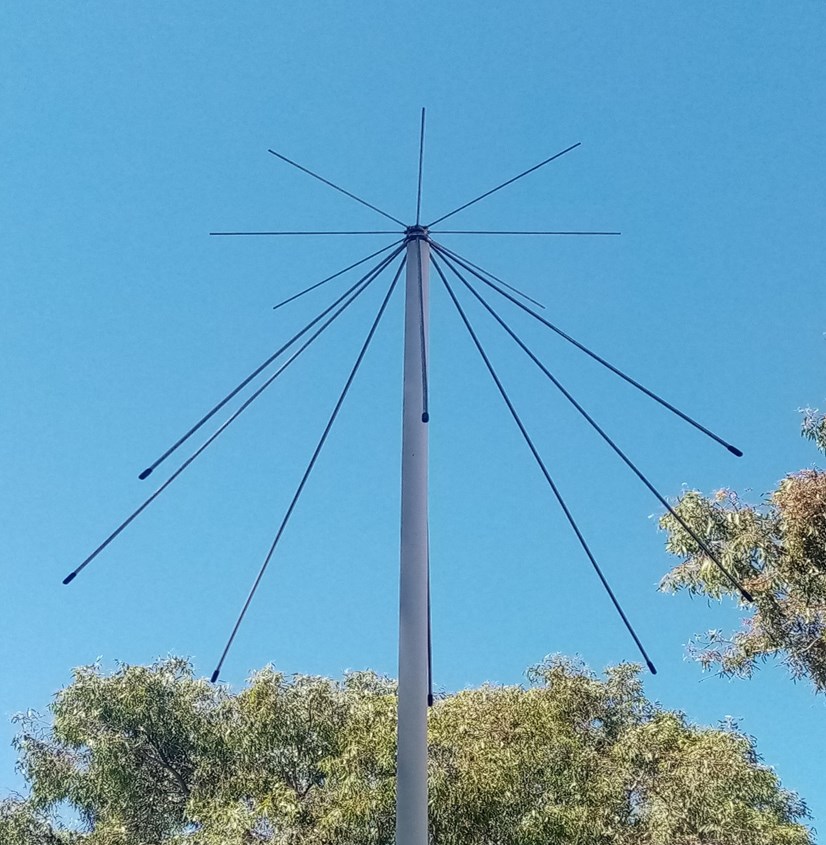
The broadband Discone antenna that I used initially for the balloon flights.
An alternative piece of software might be using a Linux programme “GQRX” although I haven’t tried this.
Experiments will determine whether a low noise input pre-amplifier (LNA) will be required to make the receiver sensitive enough to receive the signal (many choices on EBAY) or if a narrow band input filter is required to reduce inference from other stronger tv and radio signals.
We can make a suitable antenna:
https://m0ukd.com/calculations/quarter-waveground-plane-antenna-calculator
and for the filter model FBP-403s https://ebay.com/p/20037675914 or similar might be required.
For tracking a balloon and having its position shown on a map – Project Horus has some suitable software. https://github.com/projecthorus/chasemapper
Balloon Flight monitoring Using SDR#. (what I did)
I have an old WIN 7 computer that I used for various “radio” projects in the past and “it still works”.
These ‘dongles’ are manufactured to allow the reception of Digital Video and Television (DVT) on a computer and require different configurations to receive ‘normal’ radio broadcasts, be used for radio astronomy and to receive signals from weather balloons.
Luckily, a lot of people want to be able to do this (use these DVT dongles for things that the manufacturer didn’t plan) and have written lots of excellent software that enables us to do this relatively easily and more importantly, cheaply.
One of the best and most used is an application suite ‘SDR#’ available from AirSpy https://airspy.com/download This is ‘freeware’, there is no cost to download and use this application!
This download includes everything needed to use a ‘DVT dongle’ for radio reception.
Follow the instructions for installing the software and enables you to then instal the right sort of device driver that allows the digitized output of the ‘dongle’ to be available to the Windows computer and SDR#.
In the SDR# folder there is an executable called Zidig.exe. Zidig.exe installs the correct device driver so that SDR# can ‘see’ the output from the dongle.
Plug your dongle into a USB port then
Run ‘Zidig.exe’
Under Options, select ‘list all devices’
In the drop-down menu,
Select ‘Bulk-In, Interface(Interface 0)’
Install Driver
Close Zidig.exe.
Start SDR# and select the appropriate source from the ‘settings’ icon, (other sources are listed too), configure the device, attach a suitable antenna and wait for the balloon launch time.
In South Australia this is 2315 GMT or 1115 GMT (9:45 or 21:45, CST in the Summer).
The balloons are launched from Adelaide Airport by the Australian Bureau of Meteorology (BOM).
Other states also have launches, but they might be at different times, so a Google search for launch information might be required.
A minute or so after the launch time, a visual and audible signal should appear between 400.5 MHz and 402.5 MHz
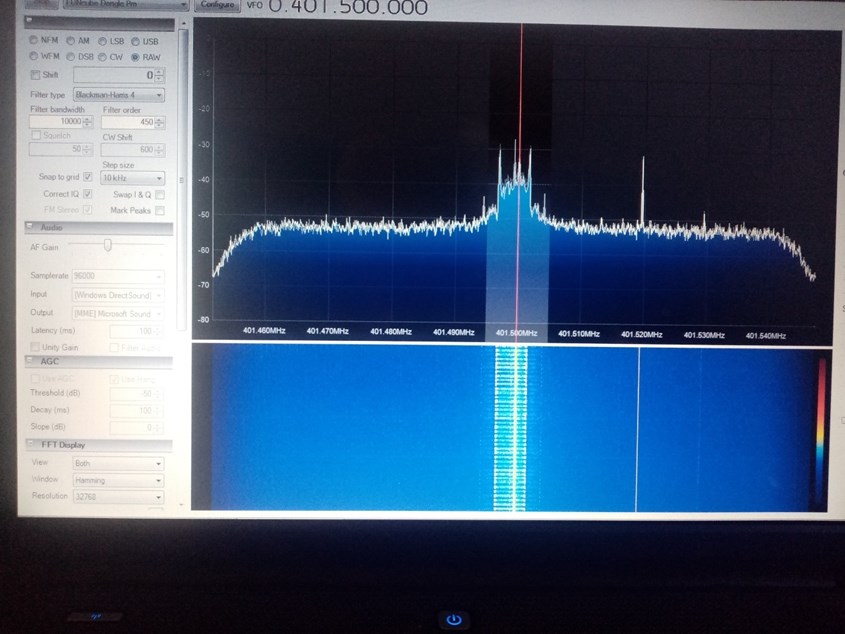
Typical SDR# display showing the received signal from a balloon.
Decoding the data
If the sonde you receive is a Vaisala R92SGP, (which is no longer launched by BOM in Australia), then you’re lucky as these have a continuous output signal and this can be easily decoded with software from COAA called SondeMonitor. https://www.coaa.co.uk/sondemonitor.htm which has a 30day free trial and a minimal licence fee after that.
Depending on the strength and direction of the wind, the balloon will move around during its flight and can be tracked using the “radiosonde-auto-rx” software.
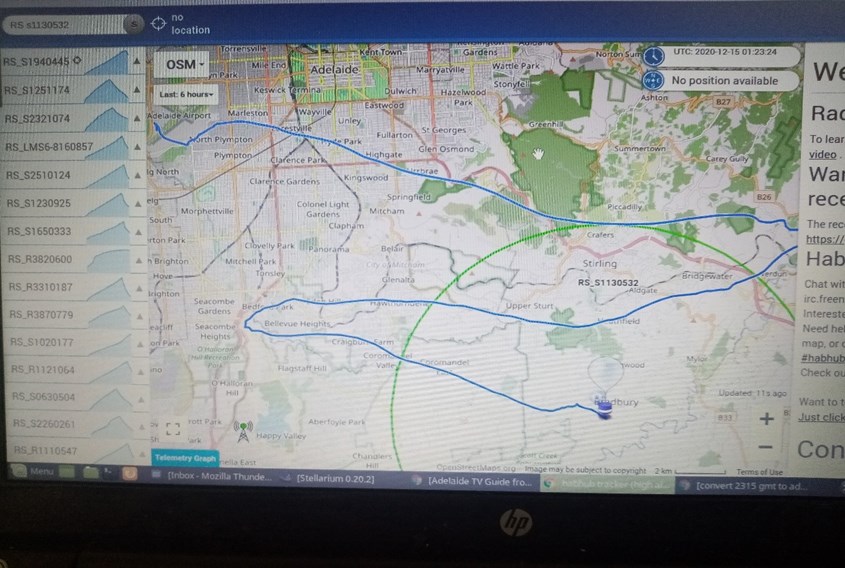
A typical ‘plot’ of a balloon flight recorded from Adelaide.
If using a Linux OS computer, the software can also upload the telemetry data to APRS-IS etc for mapping purposes. You can also join their Facebook Group if you intend to try and recover a radio sonde.
Currently (2021), BOM are launching balloons fitted with Vaisala RS41-SG sondes from Adelaide Airport and decoding these is somewhat problematic. This sonde’s signal turns on and off about every 0.5 seconds and is a digital transmission. COAA’s SondeMonitor software https://www.coaa.co.uk/sondemonitor.htm ‘should’ be able to decode these but I’ve not had any success with using that software to decode Vaisala RS41-SG digital transmissions.
All is not lost; however, you will have to read part 2 to see how these digital sondes can be tracked.
J D 16-December 2020
Tracking Balloons – part 2
In part – 1, it was shown that a moderately simple setup could track a weather balloon released by the Bureau of Meteorology from their facility at Adelaide Airport. https://5dme.net/weather-bom-adelaide-airport-facility/
This part will expand on that concept, show you how to decode the data from balloons that have the Vaisala RS41-SG radiosonde fitted and upload the data to the internet.
Receiving Antenna
Commonly used by amateurs who track these balloons, is a mono-pole antenna – a simple ¼ wave vertical rod with other rods as a ground plane.
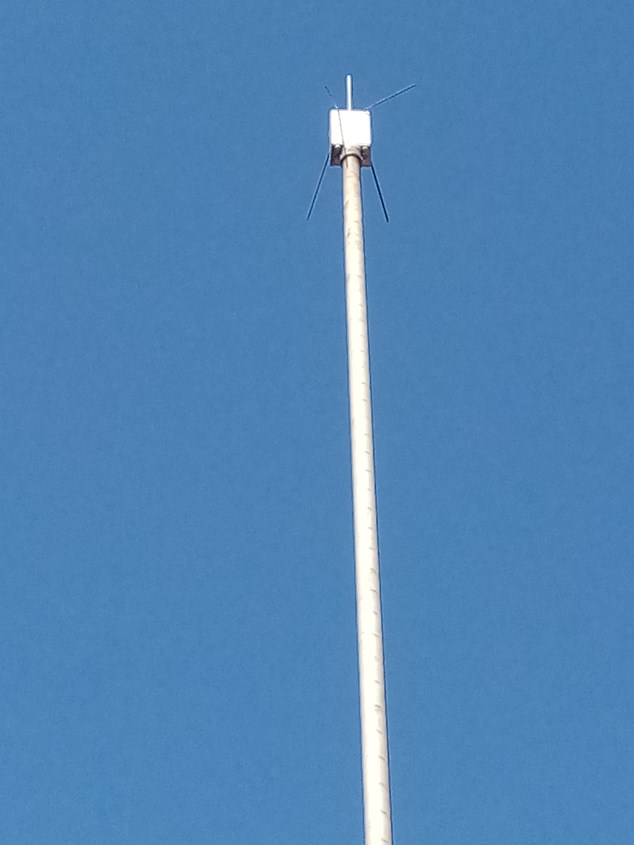
My 1/4 wave antenna
One was fabricated using the following web page. 1/4 Wave Ground Plane Antenna Calculator – M0UKD
Front End Electronics (Low Noise Amplifier)
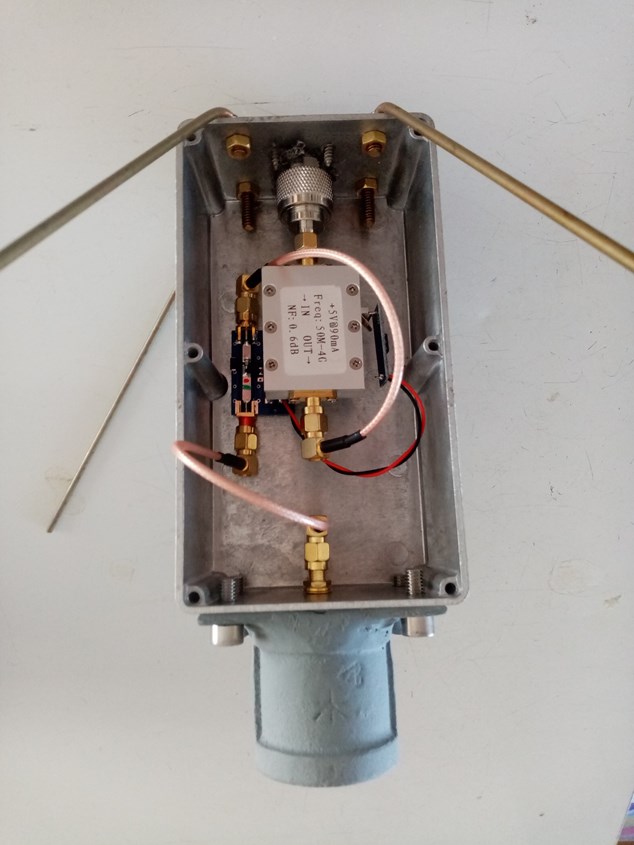
Closeup of the pole mounted box containing the LNA, an T Bias and the rods that form the ground plane.
The box on the top of the pole, as well as the antenna, contains a low noise amplifier (LNA) with 20dB gain, a ‘reverse’ EME-195 Tbias card and a small 5-volt regulator module close to the amplifier. The box is sealed to prevent moisture entry as much as possible and also contains some small packets of desiccant to ‘soak up’ any residual moisture in the box.
Receiver and LNA power supply
The LNA on top of the pole is powered via the coax cable from a DC source from two 18650 Li-ion batteries which provide about 7.4 Volts. This is located alongside the receiver and computer in the house.
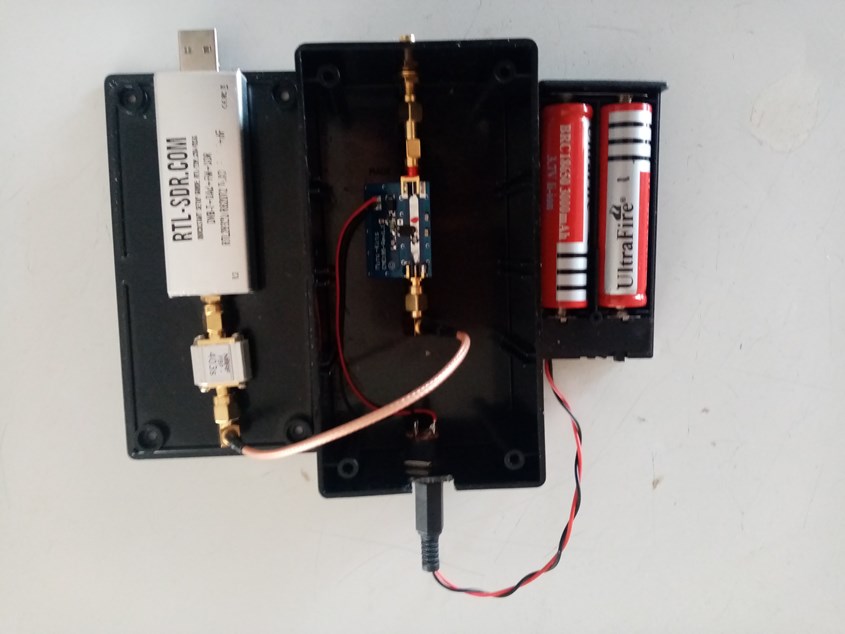
Receiver with the narrow band SAW filter and battery powered T Bias
To separate the signal from the DC voltage, a bias T card from local supplier Minikits (EME-195) is used at each end of the coax feed line. At the lower end of the coax, after the bias T card is a SAW (surface acoustic wave) filter with a bandwidth of 4MHz and covers the 400 MHz radiosonde frequency. The filter could have been placed at the top end of the coax line, but space did not permit it. Low loss coax CLF240 about 15m long is used, which gives a big improvement (7db!) in signal at the dongle over the RG58 coax that I was using previously.
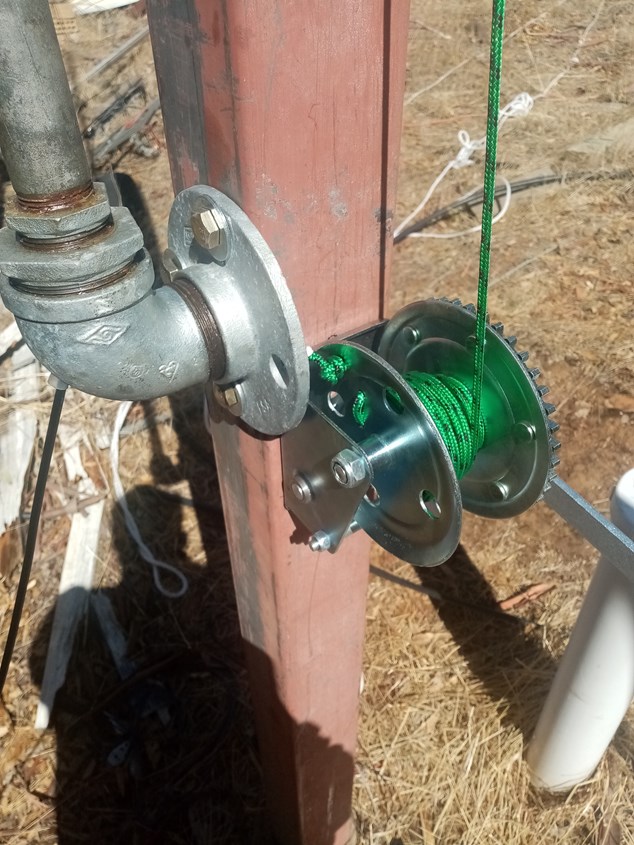
Mast winch and rotating 'bearing' fashioned from well greased pipe fittings. This allows the mast to be easily lowered for changes and maintenance.
In part 1, the signal was detected using either a Funcube dongle or an SDR-RTL dongle plugged into a laptop. This time the SDR-RTL dongle is plugged into a Raspberry Pi 3B+ using special software written specifically for the Raspberry Pi (rPi) by a member of AREG (Amateur Radio Experimenters Group) who also occasionally launch their own balloons.
Software
https://github.com/projecthorus/radiosonde_auto_rx
This software decodes the data from weather balloons that have RS41-SG sondes attached and writes it into a file on the Raspberry Pi (less than 1 Mb) and also sends the data online to SondeHub.
With a Raspberry Pi decoding the data, which includes a position derived from the onboard GPS, a track of the balloon’s position is drawn on a map from your data and others, who are also tracking the balloon, and uploading data to the internet showing the current position of the balloon and the projected landing position. Data is updated throughout the balloon’s flight until tracking data is not available – eg balloon is behind a hill or signal level falls below a certain value. With a clear line of sight, data can be uploaded until the balloon is within a few 10’s of metres from the ground (or water).
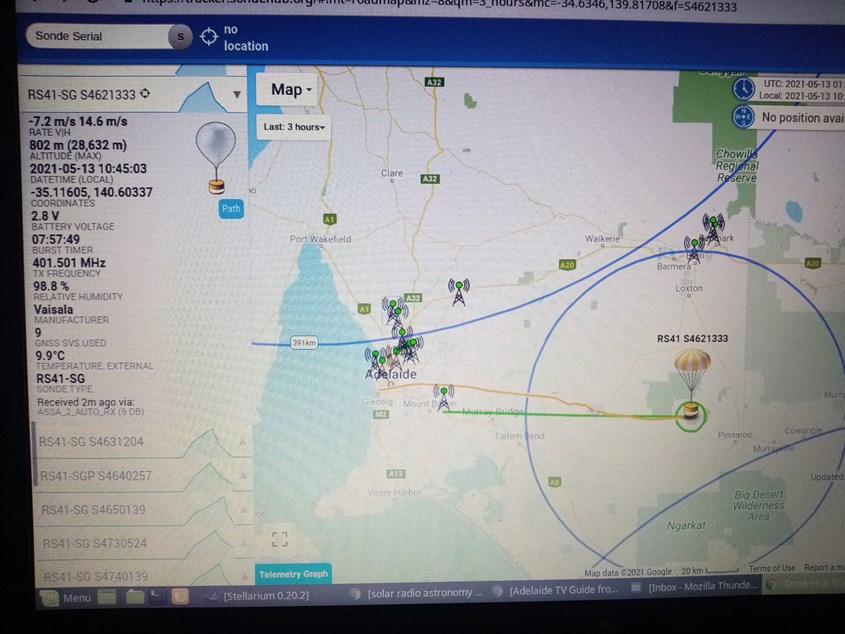
Example of a balloon track.
On the tracker.sondehub map, hundreds of balloons can be tracked anywhere in the world. By clicking on a particular balloon, the height, GPS data, humidity and temperature are shown by scrolling the left column until the appropriate balloon data is found.
There are 15 - 20 sites in South Australia and Victoria which actively track BOM weather balloons each day and there is also an active group in the Mt Gambier area. http://serg.org.au/index.php/2019/01/16/chasing-weather-balloons/
Anyone can use this programme on almost any computer and follow any one of dozens of balloons which are launched each day throughout the world. Local Weather balloons are launched at the Bureau of Meteorology site at the West Beach Airport. There are two balloons launched there each day, one at 8:45 CST and another in the evening.
I would like to thank Blair for his invaluable assistance with the hardware and ideas which were incorporated in this project and my neighbor who provided the pipe for the antenna ‘mast’.
My balloon tracking station has an Id of ASSA_2 and in the above balloon track example, in the text on the left hand side of the image that is displayed.
JD (ASSA_2) 1 June 2021
-
ASSA_2 Balloon tracking – Update (05/03/2022)
Within ASSA, there are several ongoing projects run by individuals or groups. At some stage there is probably some sort of reckoning as to how successful the current project is.
In assessing the success or otherwise of a project, there are several factors which can be taken into account. These might include – cost benefit, schedules, budget considerations, team or personal satisfaction and as in the case in question – results.
- The eCallisto solar radio telescope.
- The Seismological Association of Australia (SA members maintain a 30 station seismic network).
- A new one, which is investigating Pulsars, is another Radio Astronomy project.
- The Weather Balloon (ASSA_2) Tracking project
The ASSA_2 project went online at the end on April 2021 and by the end of the year, 249 days had elapsed.
During that period, ASSA_2 mainly tracked the morning sonde and last contact was achieved 131 times, an average 1.9 days / sonde, ie the site had 'last contact with the sonde almost 50%. There are often 15 – 20 active sites in SA and Vic which track the Adelaide BOM sondes and they share the other 50%.
At the start of 2022, the ASSA_2 project started tracking both the morning and evening sondes and in the first 31 days last contact was achieved 42 times, meaning data from the sonde was obtained down to the lowest level.
The software which is used to track and download the weather data from the sonde by many throughout the world, runs on a raspberry pi 3B+ or some other type of computer. The differences between sites is the location, the antenna, Low Noise Amplifier and band pass filter and the lead in coax. These all contribute to the success or failure of receiving 'faint signals'.
Of course, the wind strength and direction determines the final place at which the sonde settles.
ASSA_2’s location on the edge of the Mt Lofty Hills escarpment (East of Nairne in South Australia) means a large area is “visible” and so under favorable conditions the site is able to have ‘last contact’ with the sonde,
I think it's fair to say that the original goals with this project (to try and pick up and track weather sondes) has been achieved!
JD ASSA_2